W&B Example - Tabular
Detecting tabular ML models vulnerabilities in W&B with Giskard
This example demonstrates how to efficiently scan two tabular ML models for hidden vulnerabilities using Giskard, log the results and interpret them within the W&B framework in just a few lines of code. We will use the following two tabular ML models:
Model |
Description |
Training data |
|---|---|---|
|
A |
Titanic dataset |
|
A |
Titanic dataset |
[ ]:
import wandb

from giskard import Model, Dataset, demo, explain_with_shap, scan

model1, df = demo.titanic(model="LGBMClassifier", max_iter=5)
model2, __ = demo.titanic(model="LGBMClassifier", max_iter=100)  # Datasets are identical.
models = {"titanic-model_lgbm_max_iter=5": model1, "titanic-model_lgbm_max_iter=100": model2}

wrapped_data = Dataset(df=df,
                       target="Survived",
                       cat_columns=['Pclass', 'Sex', "SibSp", "Parch", "Embarked"])

wandb.login(key="key to retrieve from https://wandb.ai/authorize")
for model_name, model in models.items():
    wrapped_model = Model(model=model.predict_proba,
                          model_type="classification",
                          feature_names=['PassengerId', 'Pclass', 'Name', 'Sex', 'Age', 'SibSp', 'Parch', 'Fare', 'Embarked'],
                          classification_labels=model.classes_)

    run = wandb.init(project="titanic_demo", name=model_name)

    # Log results to the new W&B run.
    wrapped_data.to_wandb()

    shap_explanation_result = explain_with_shap(wrapped_model, wrapped_data)
    shap_explanation_result.to_wandb()

    scan_results = scan(wrapped_model, wrapped_data)
    scan_results.to_wandb()

    test_suite = scan_results.generate_test_suite()
    test_suite.run().to_wandb()

    # Finish a current run.
    run.finish()
After logging the results, you can visualise them on the W&B User Interface by running wandb server start via http://localhost:8080. You will be able to visualise the following:
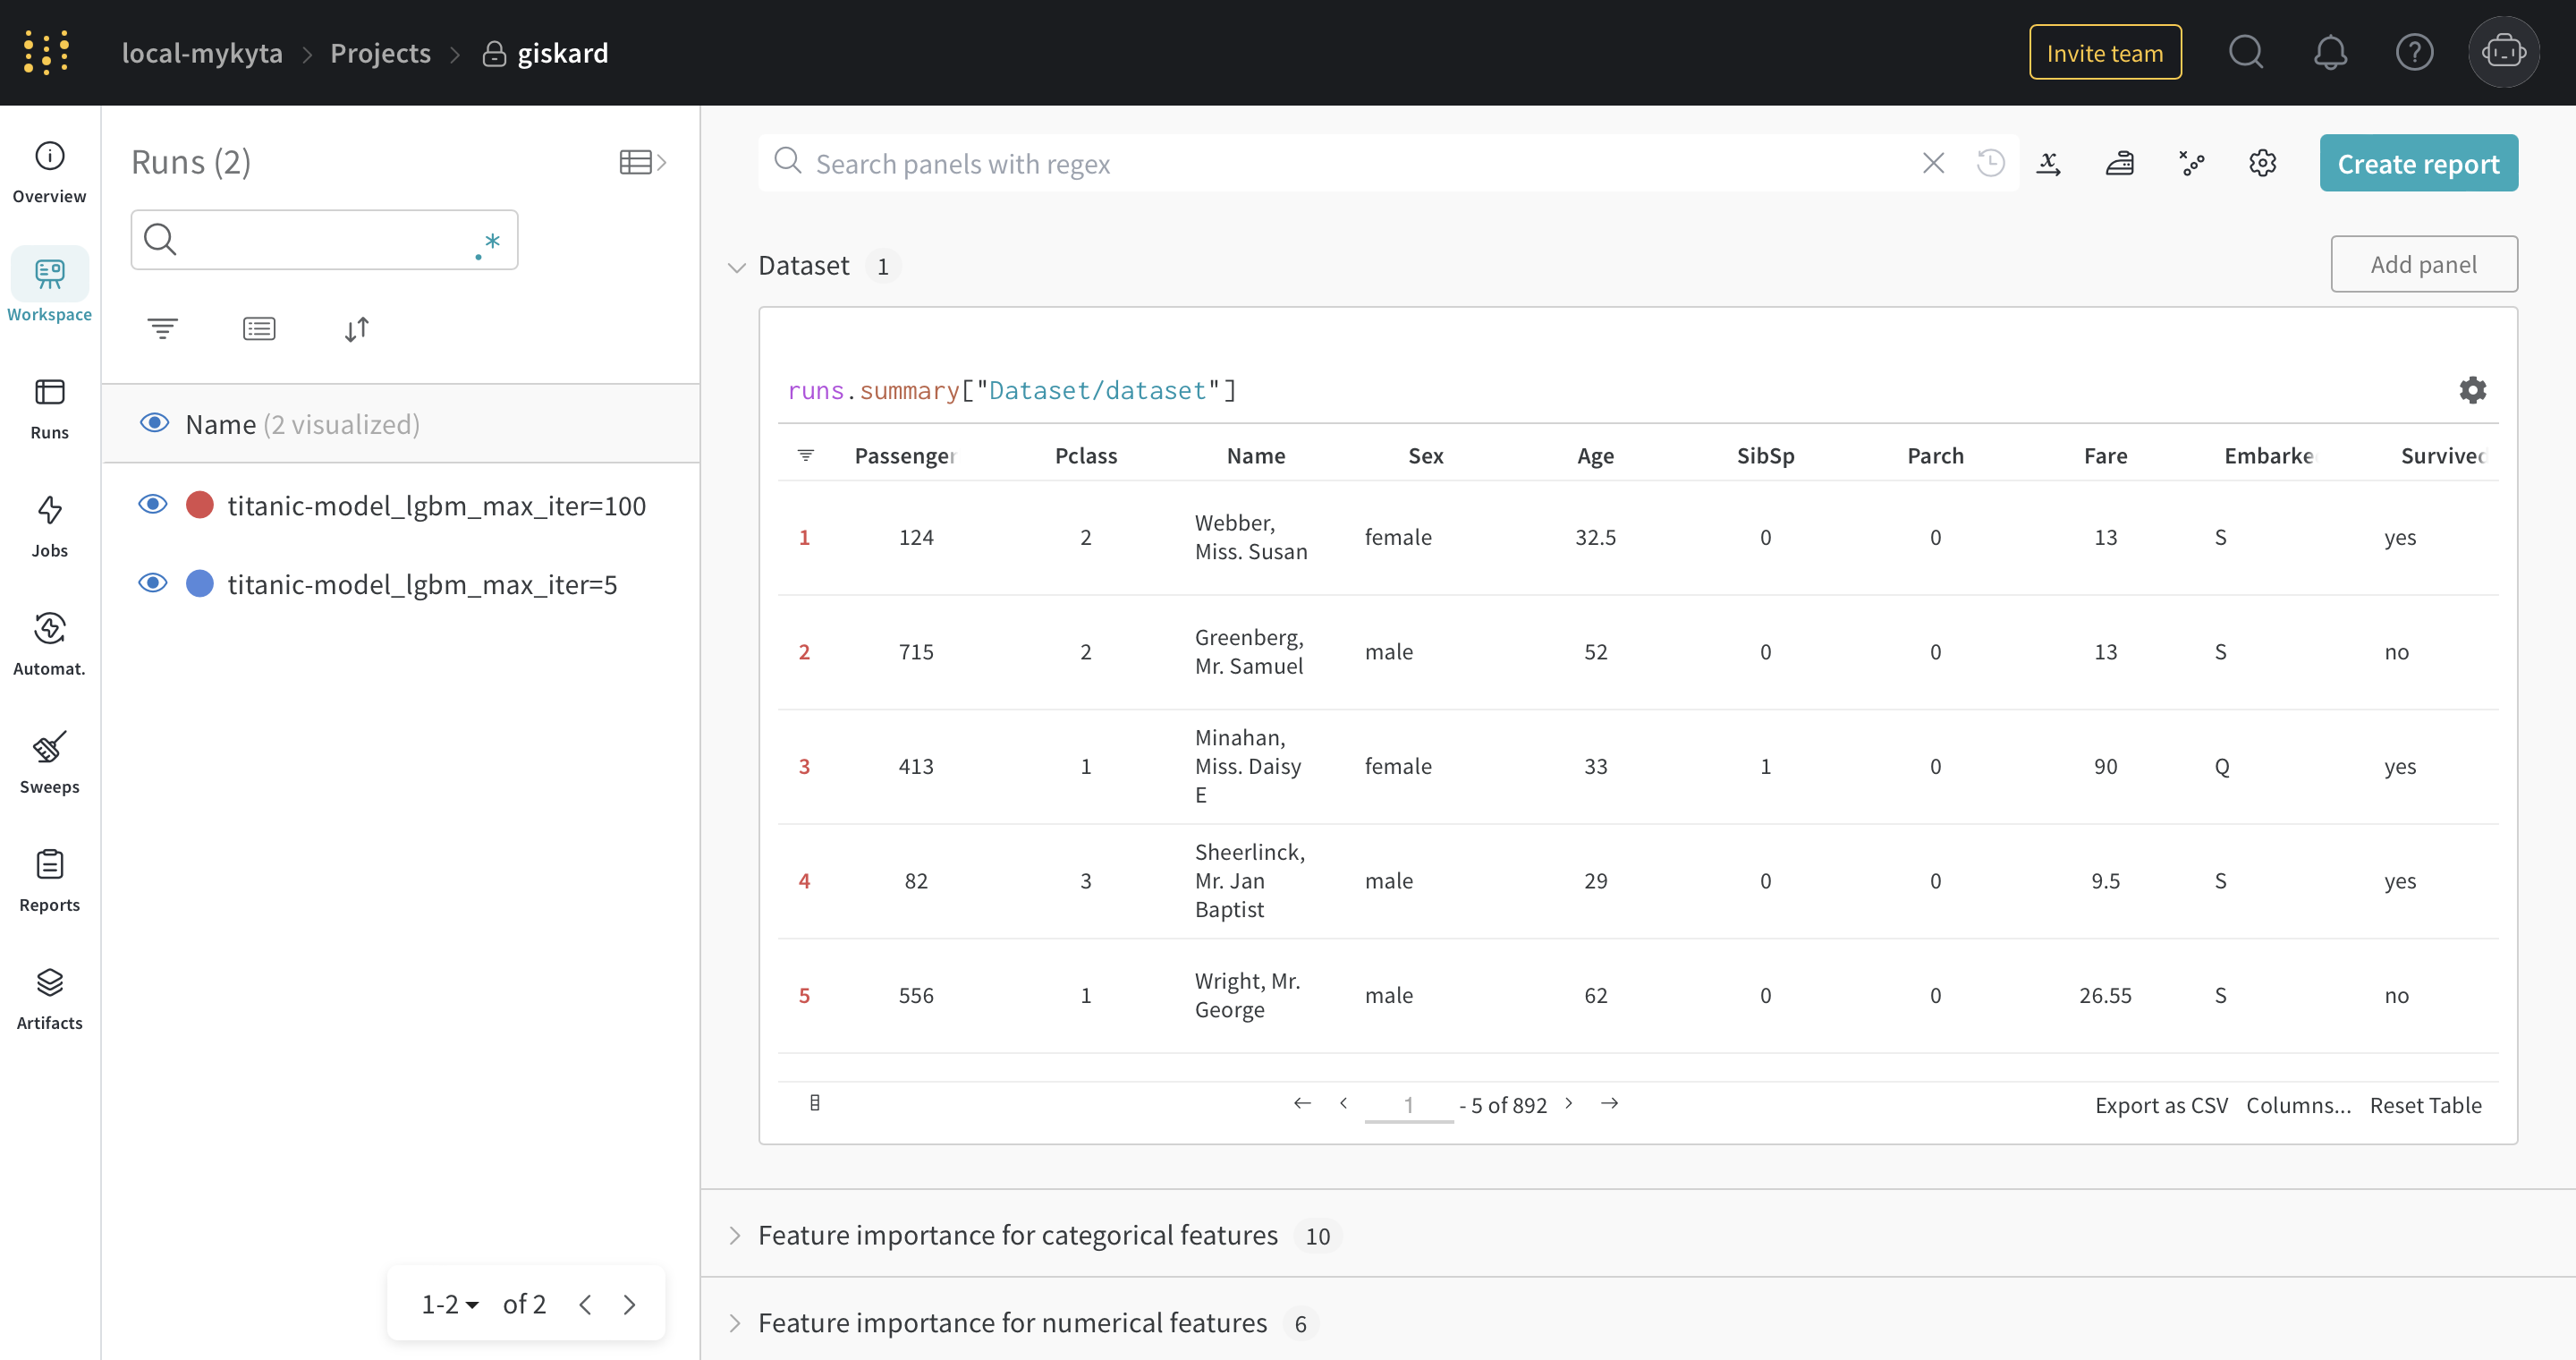
The dataset
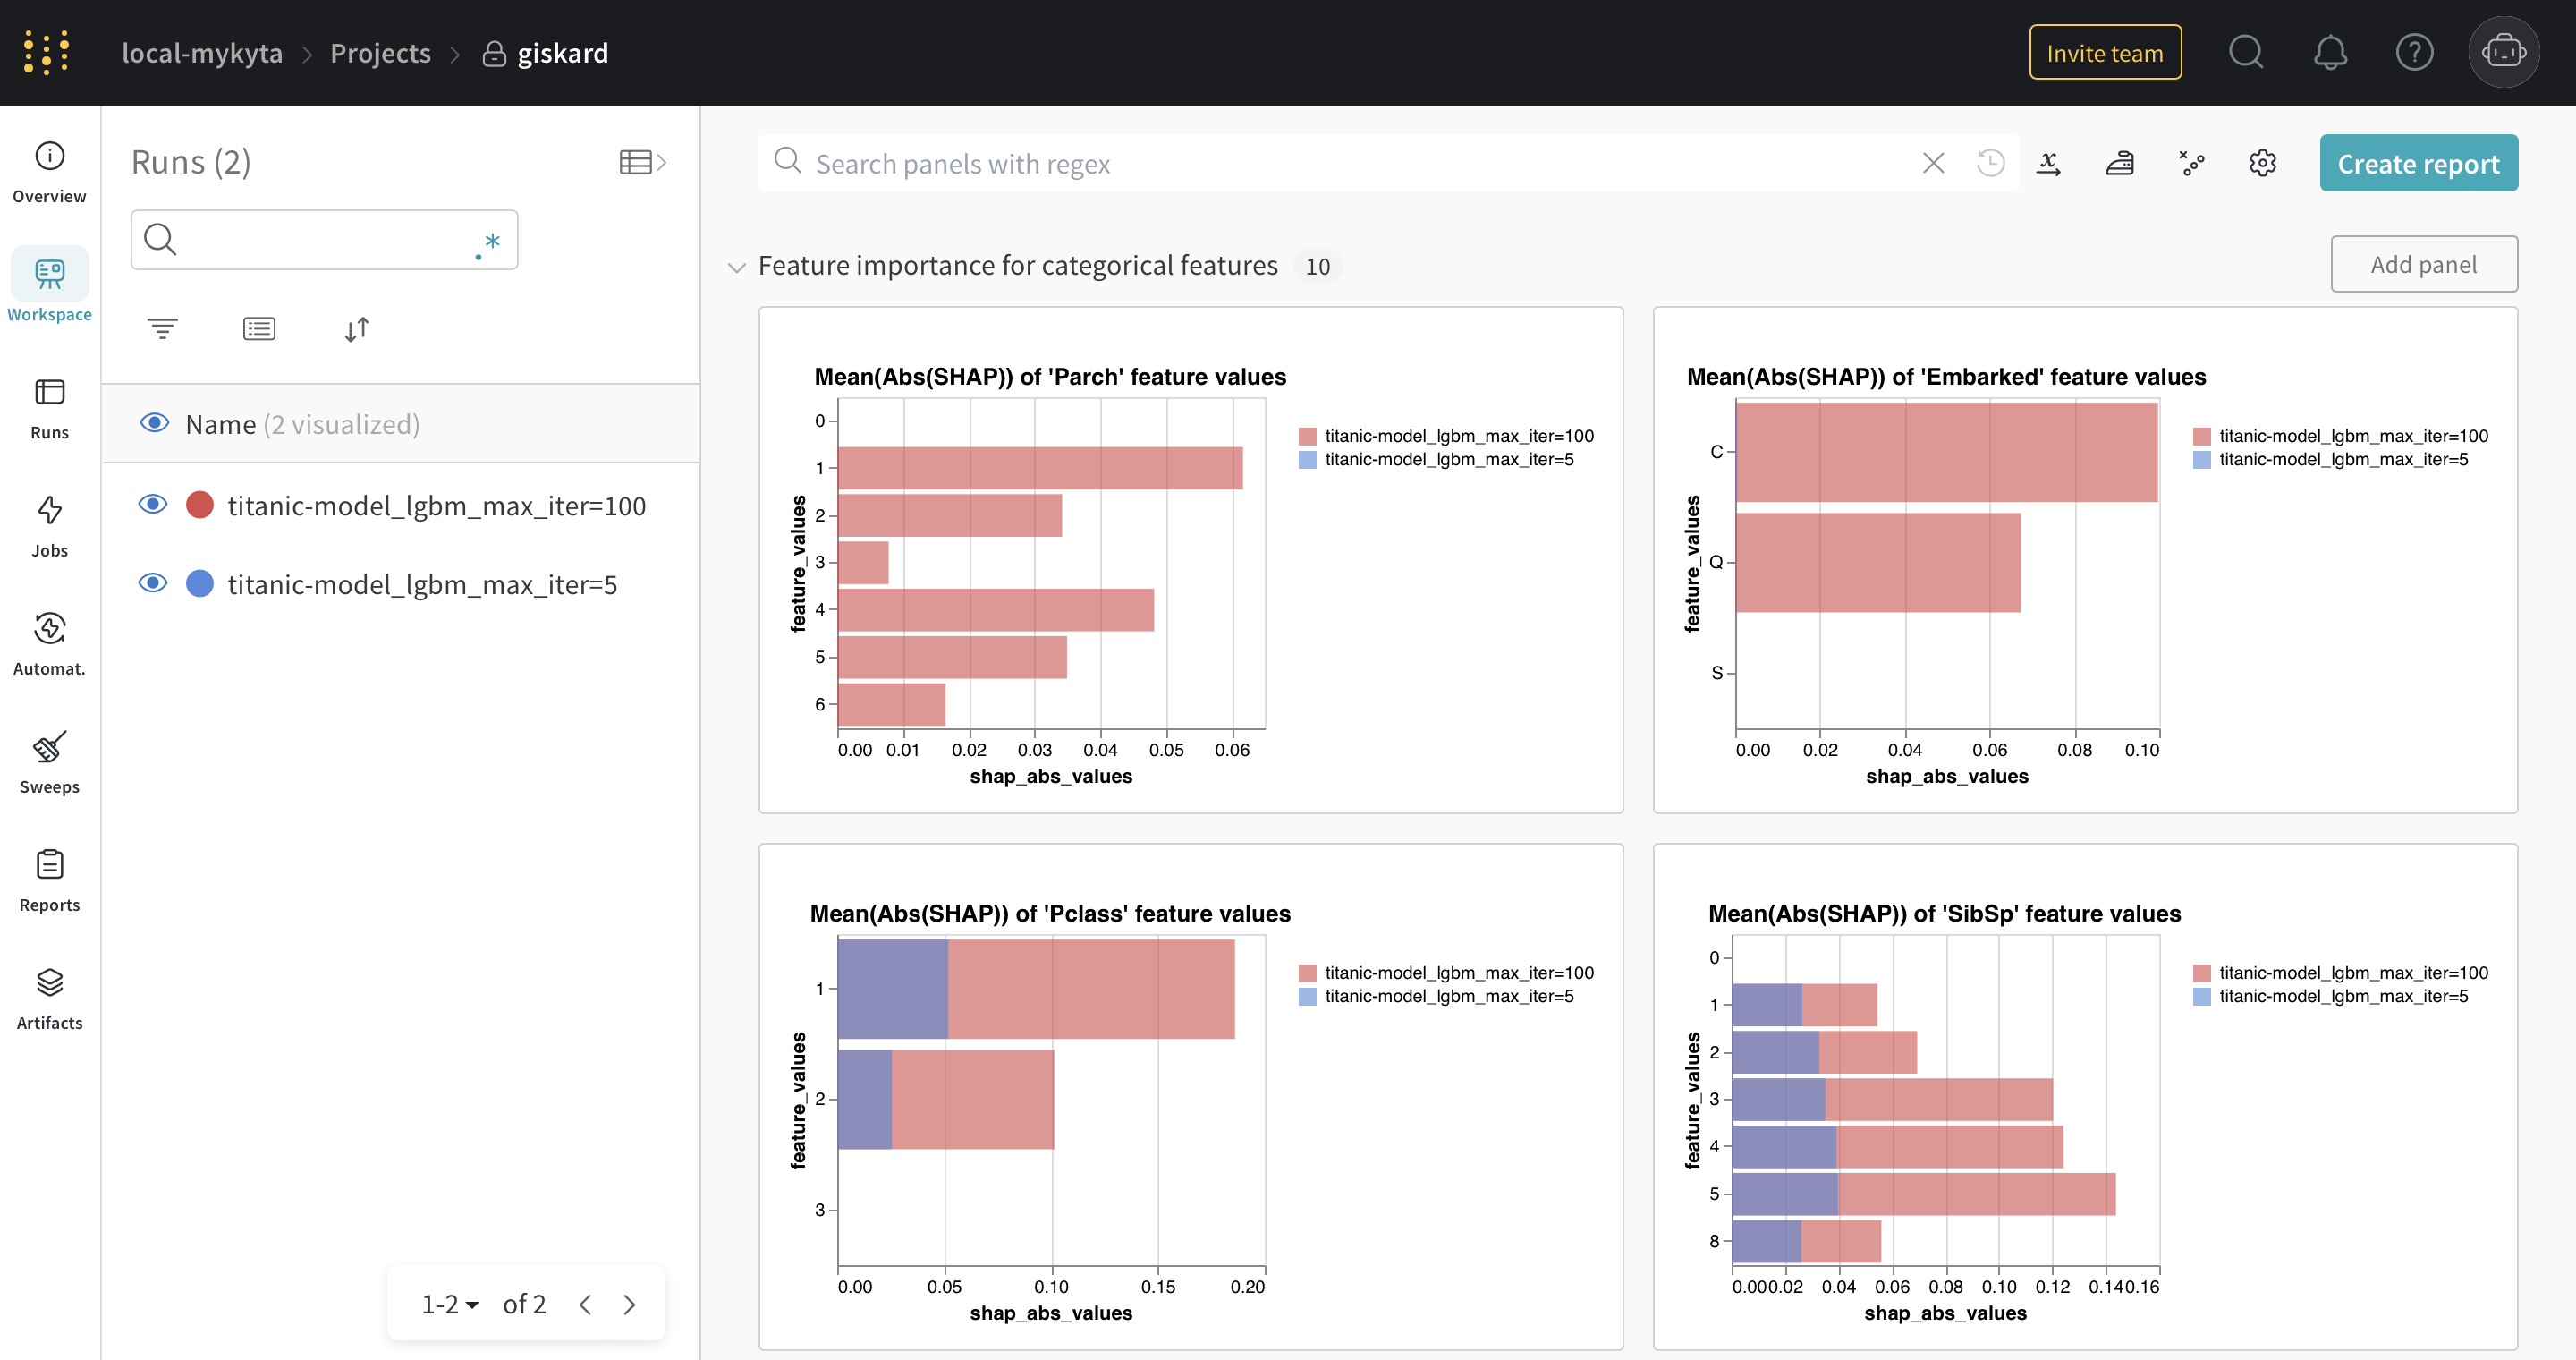
The SHAP bar plots for categorical features
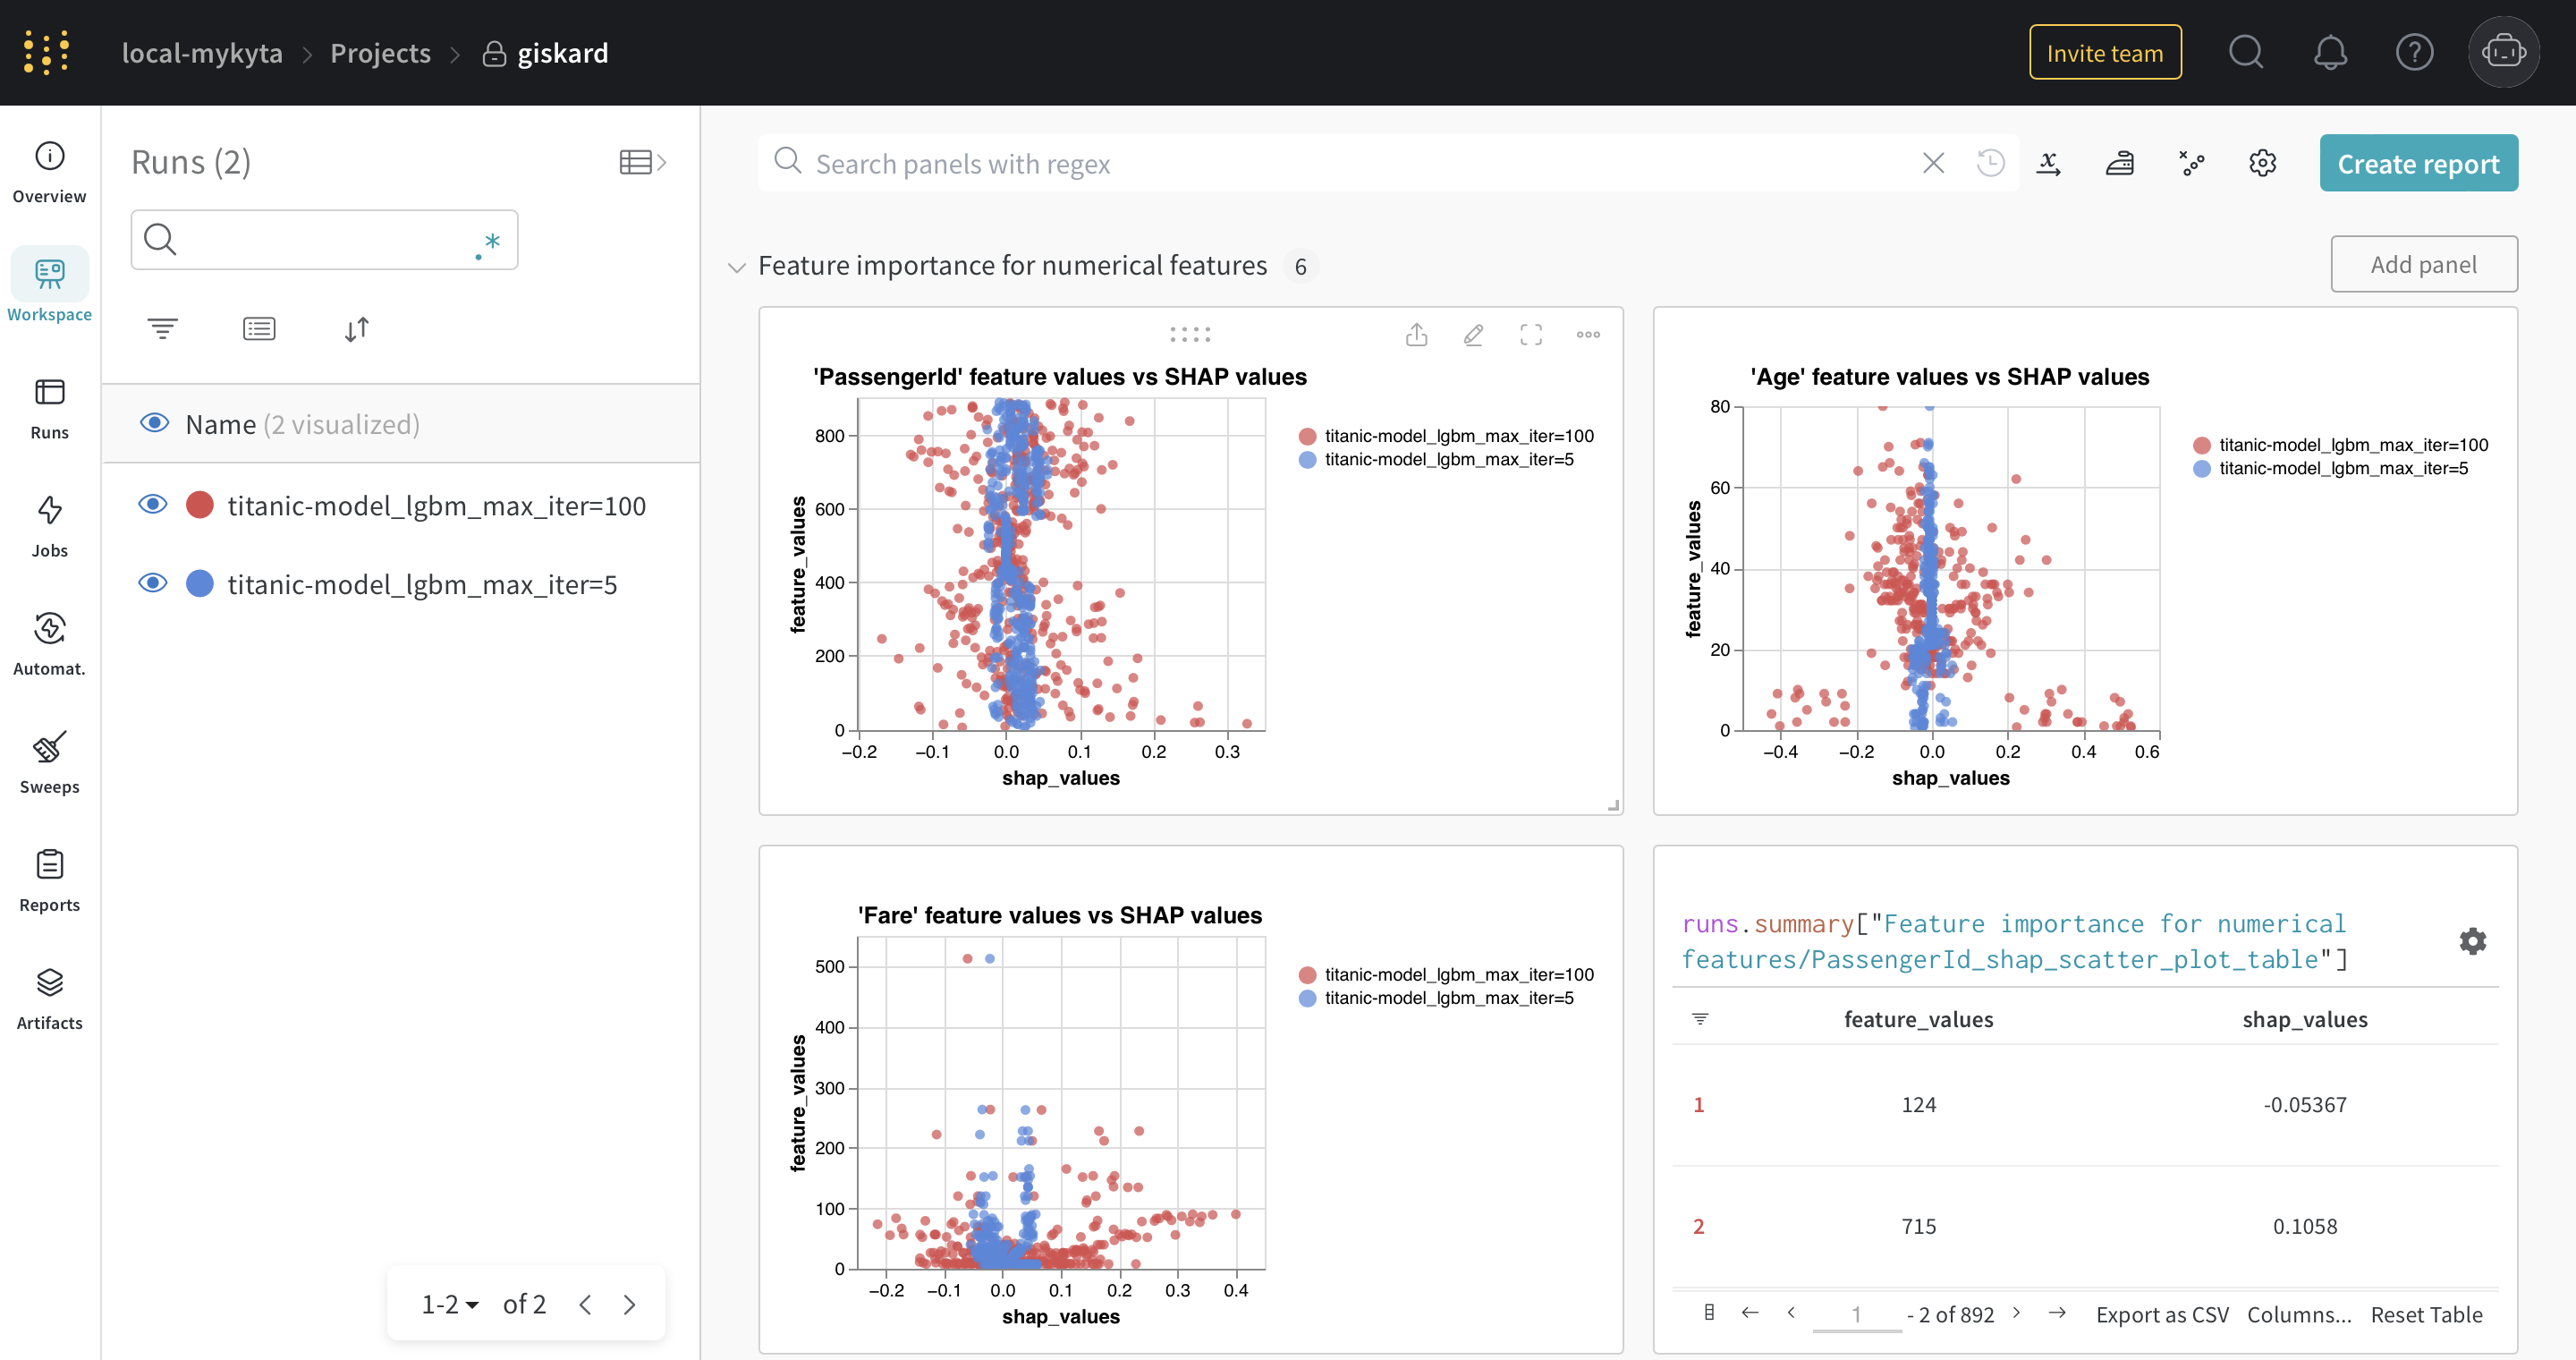
The SHAP scatter plots for numerical features
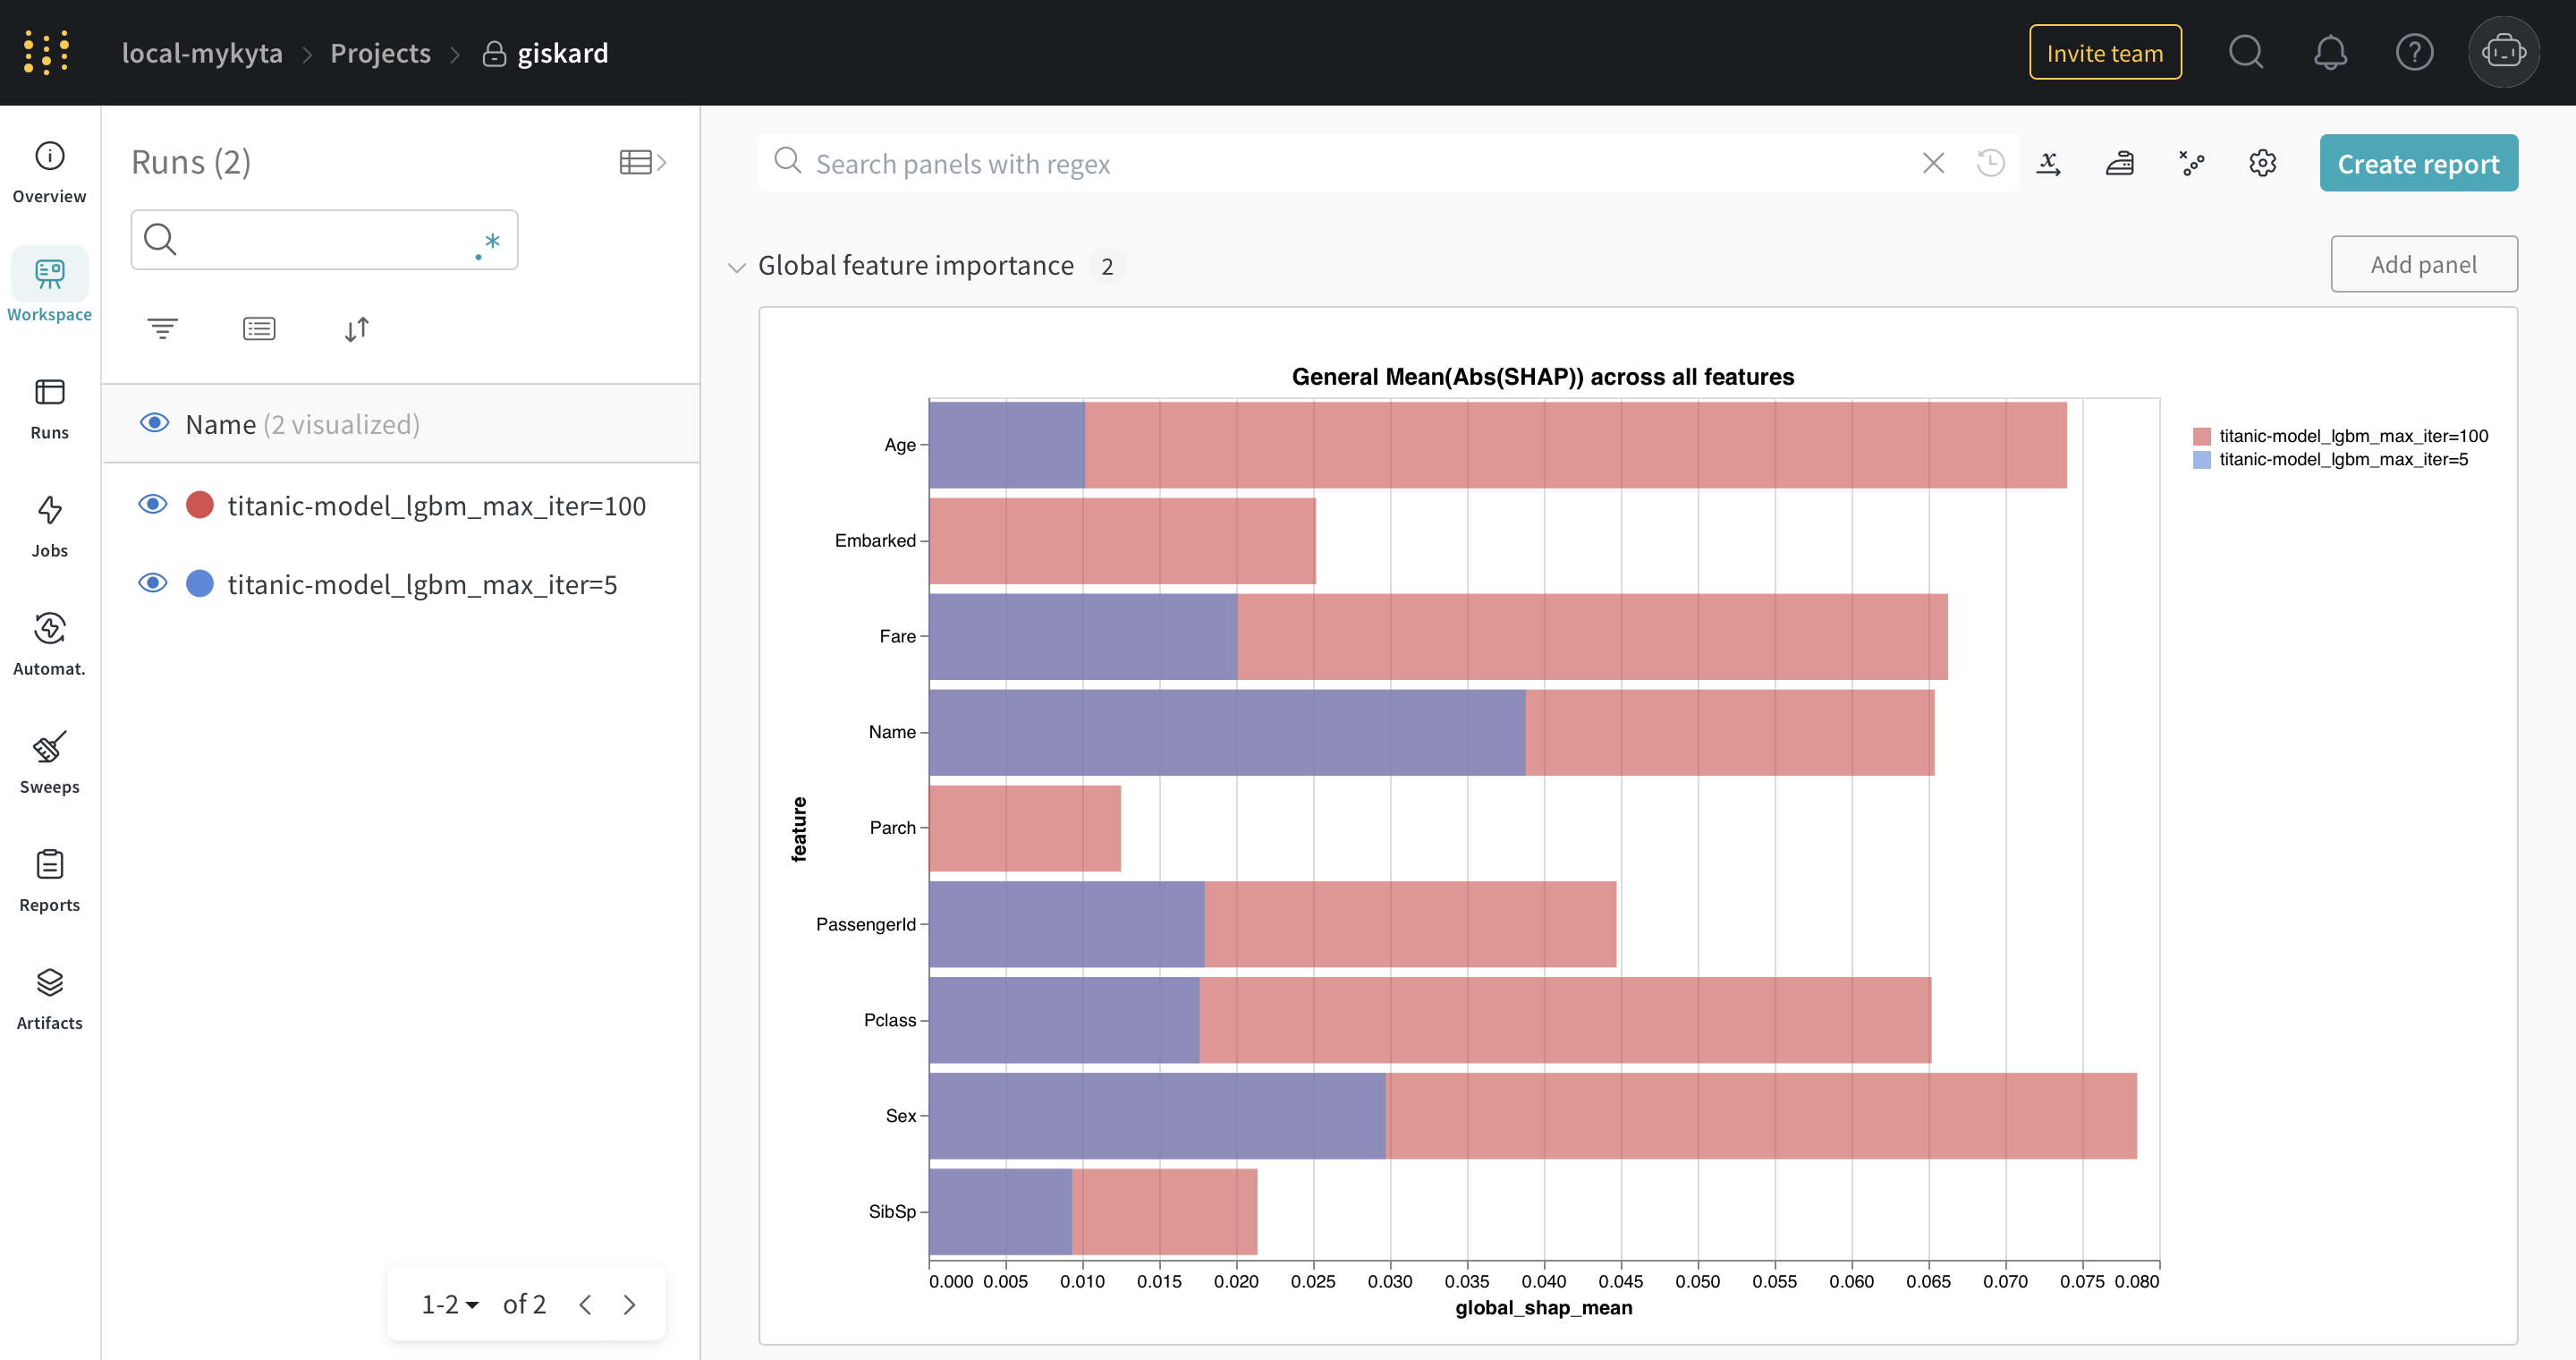
The SHAP global feature importance plot
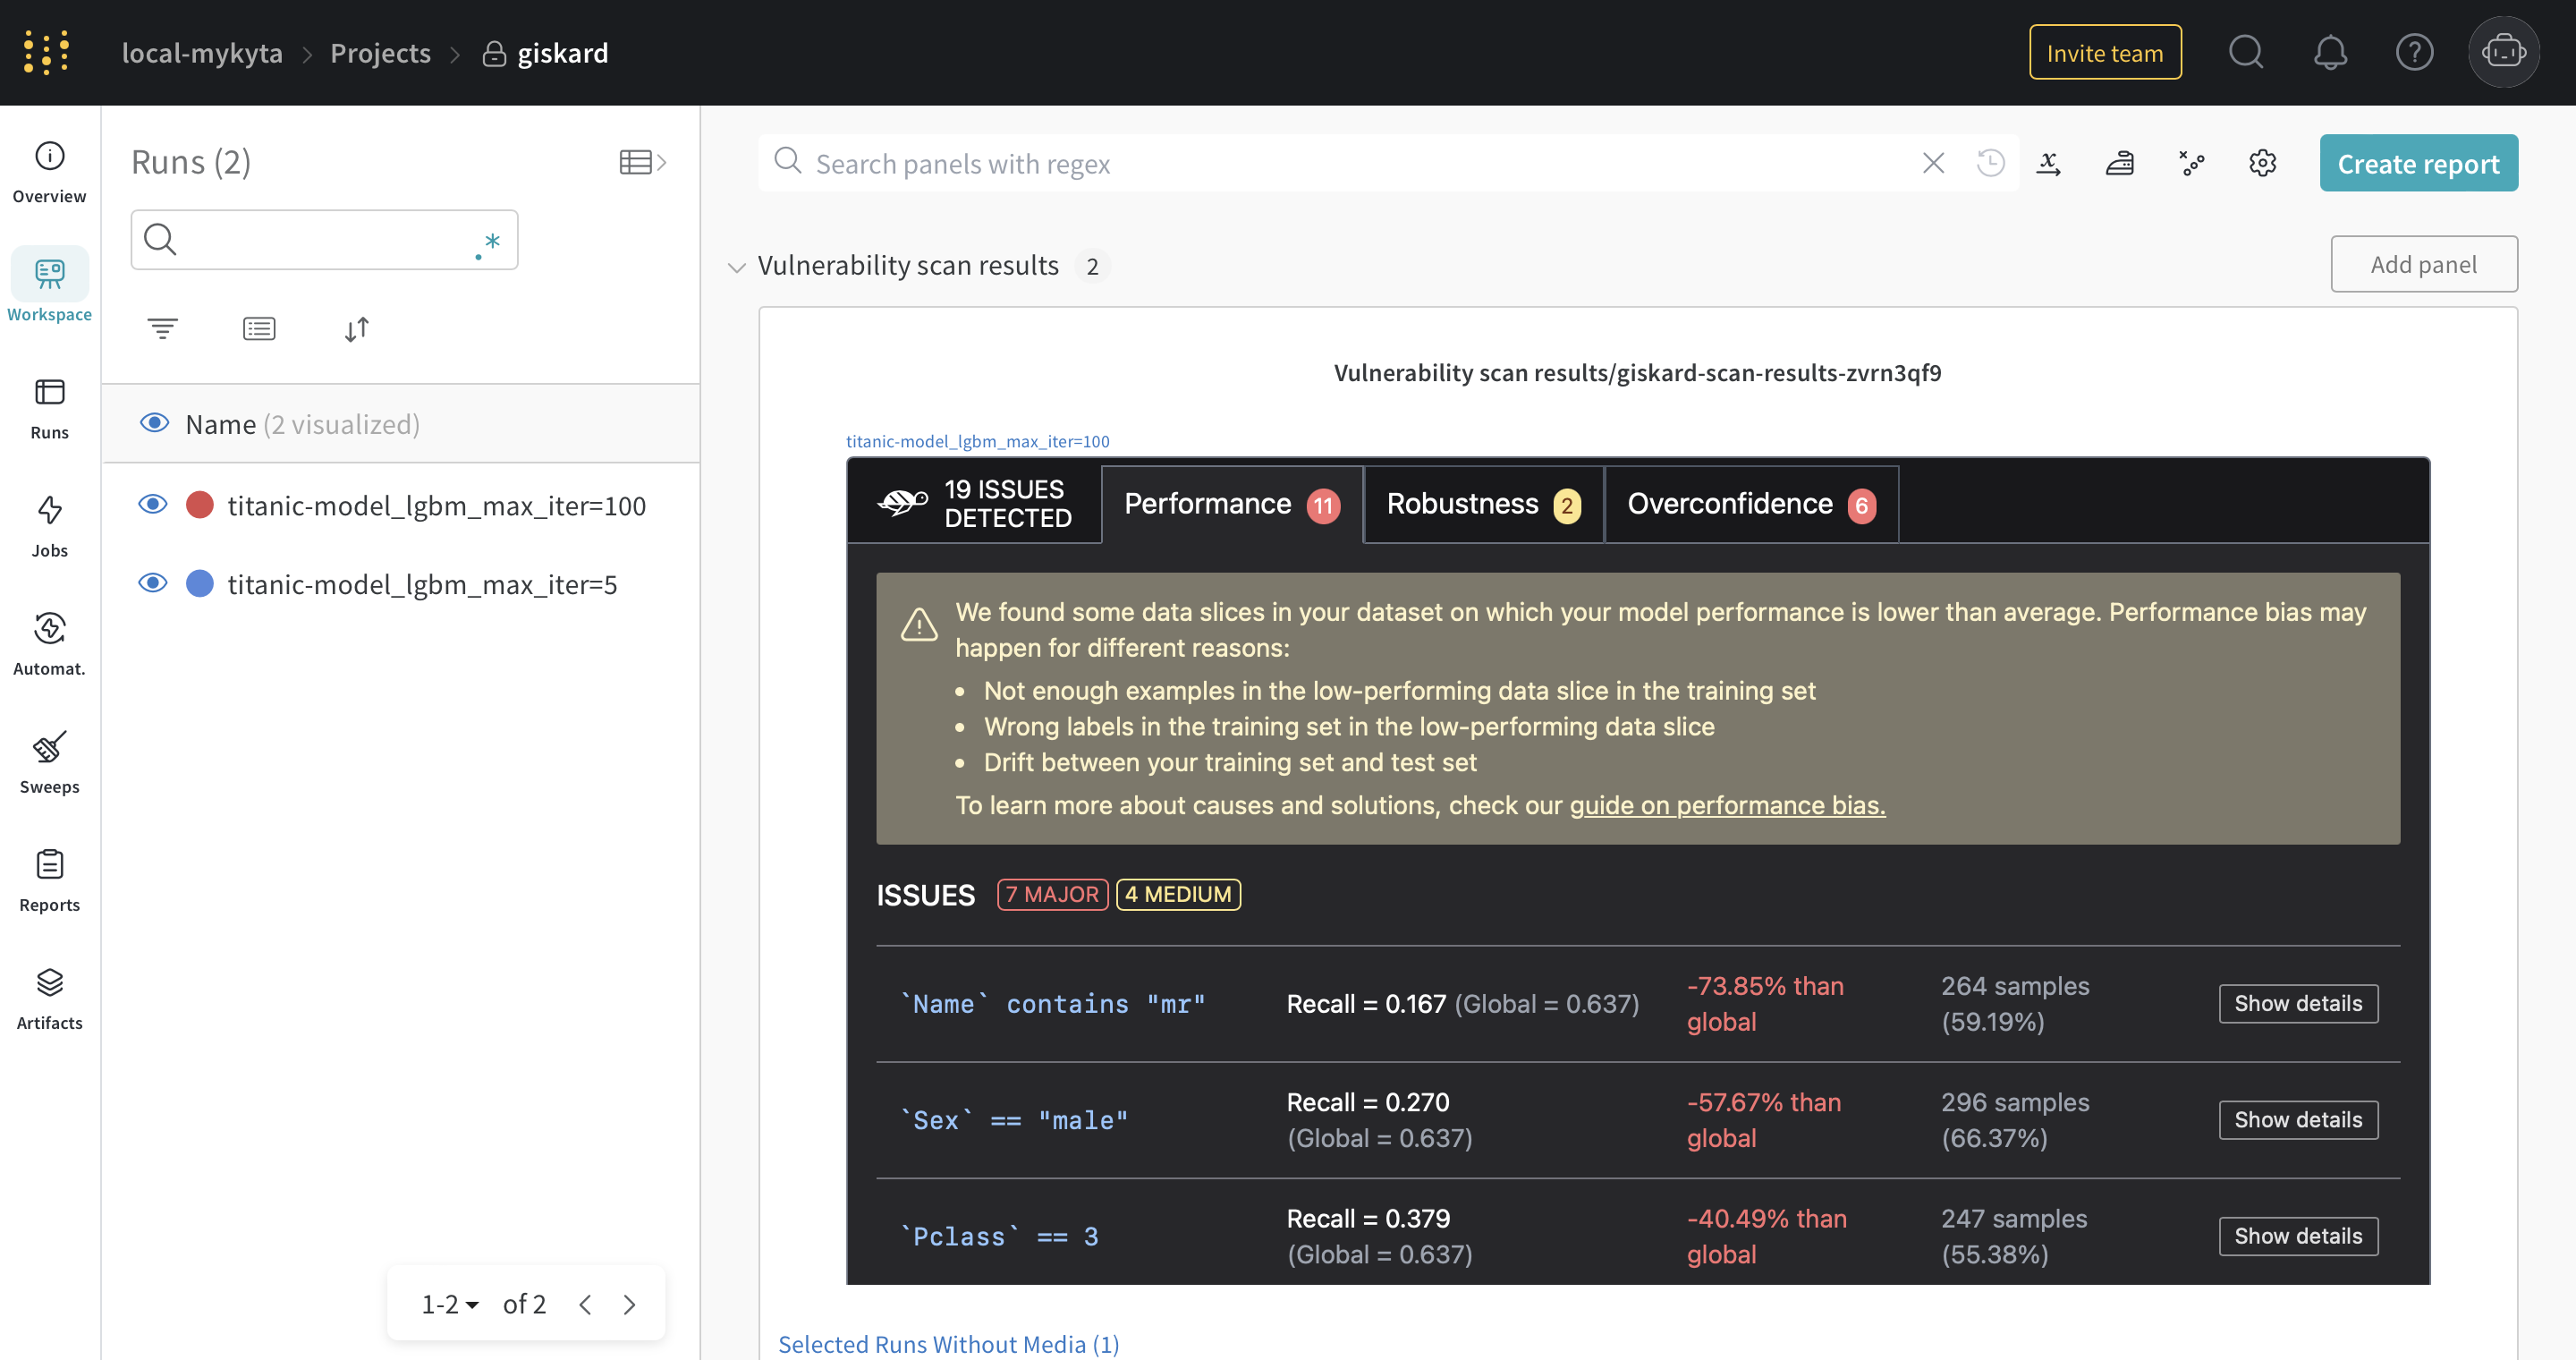
The Giskard scan results
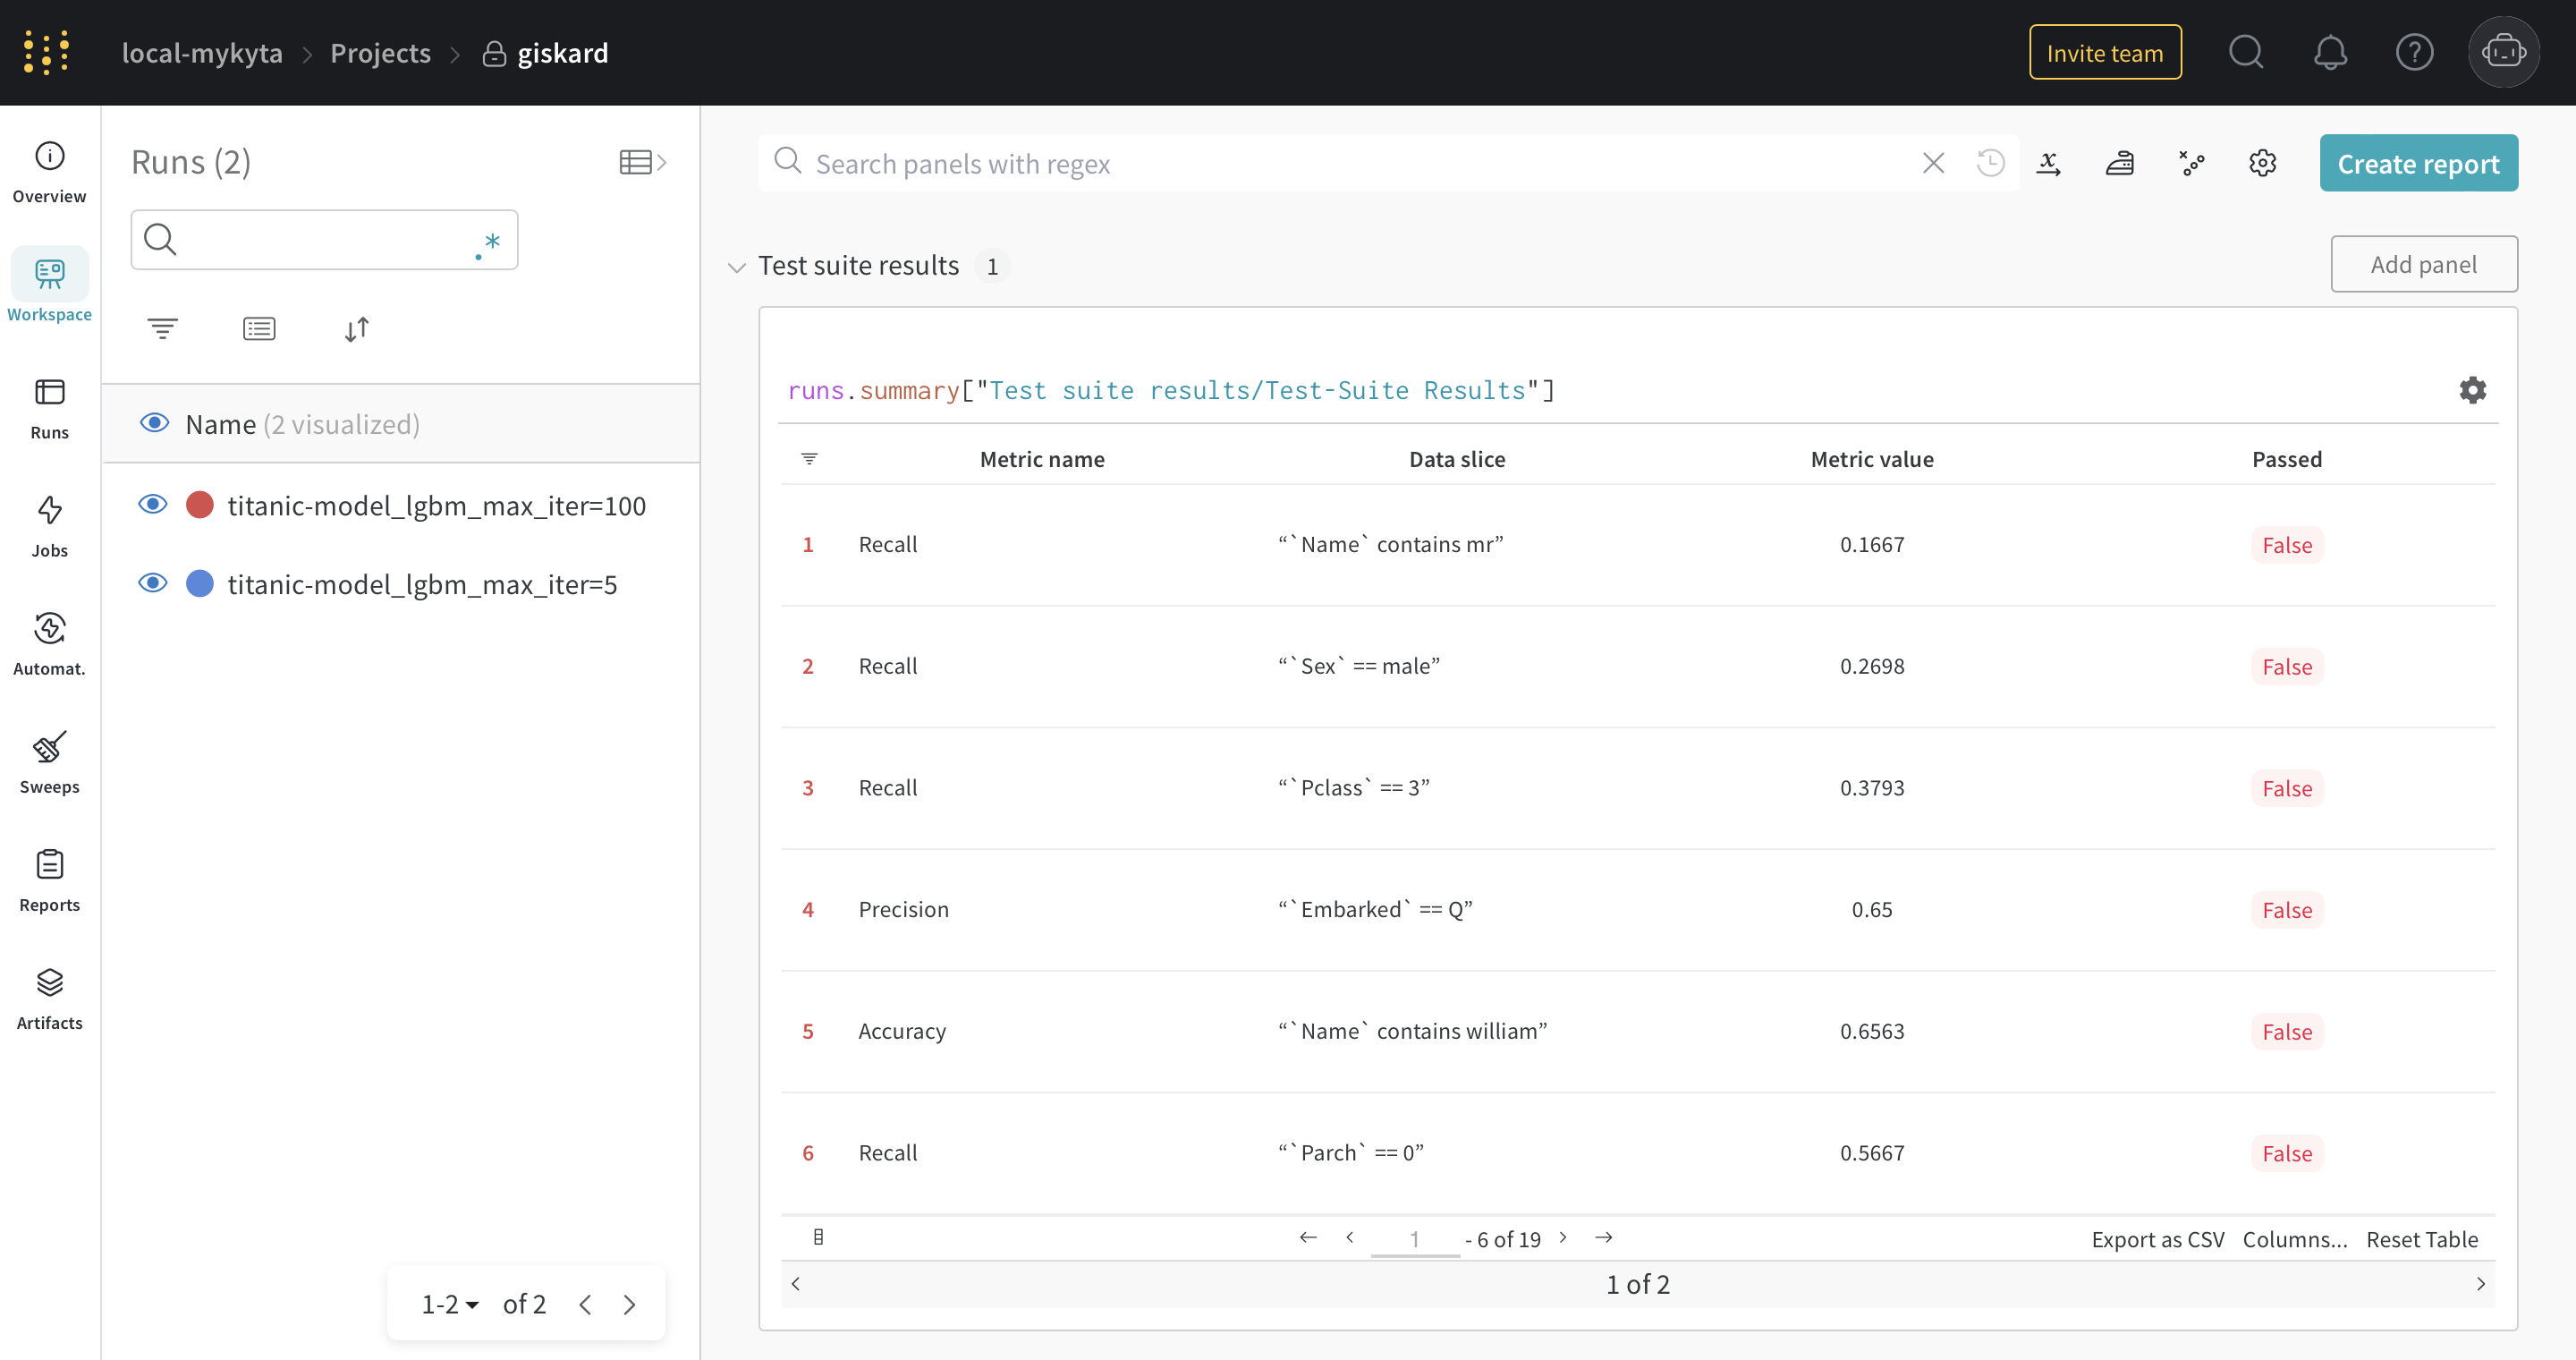
The Giskard test-suite results